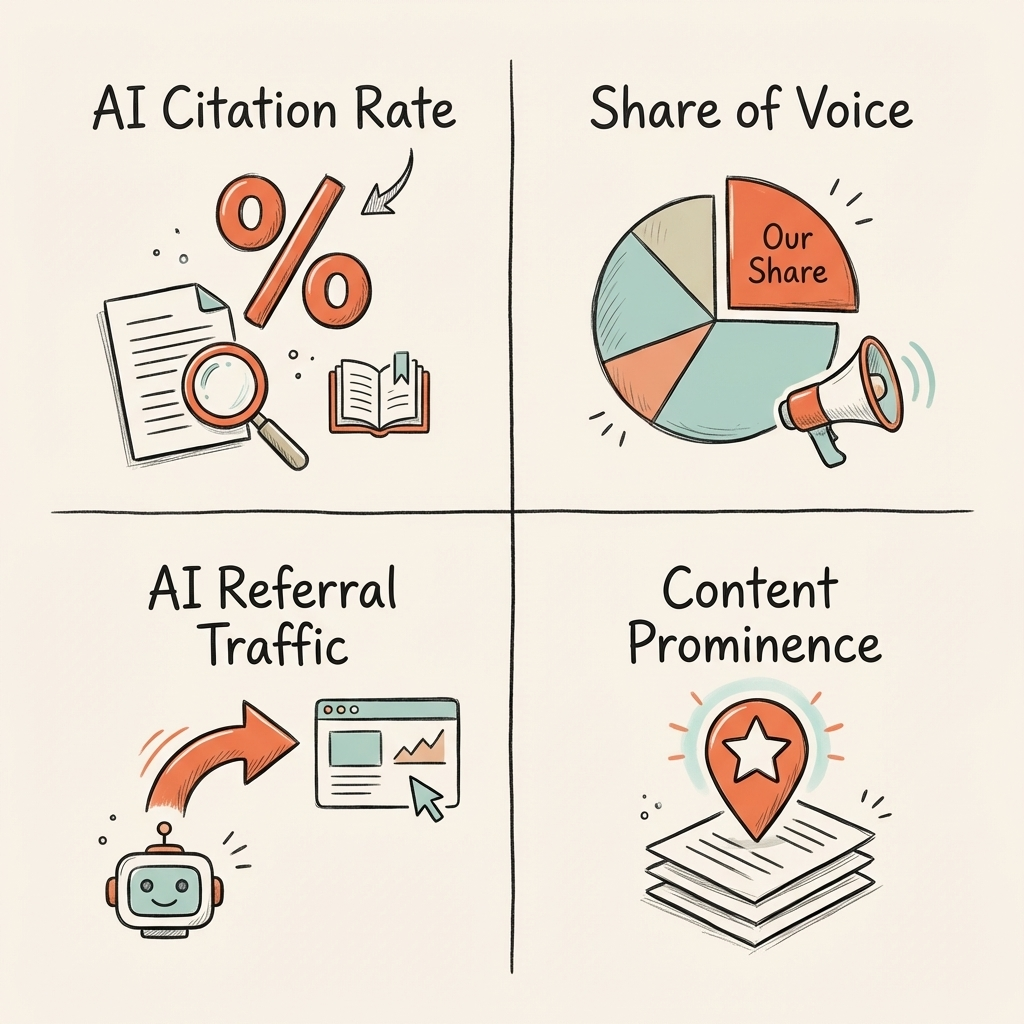
GEO performance is measured through four metrics: AI citation rate, share of voice in AI responses, referral traffic from AI platforms, and content prominence within answers. A page can rank #1 on Google and earn zero citations from ChatGPT — traditional SEO metrics measure the wrong thing.
Why standard SEO metrics miss AI visibility
Keyword rankings track position in a list. AI visibility tracks whether your content appears inside synthesized answers — a fundamentally different question.
When a buyer types "what's the best project management tool for startups?" into ChatGPT, the response doesn't link to ten blue results. It synthesizes an answer from sources it deems authoritative. Your Google ranking for that keyword is irrelevant to whether you appear in that answer.
The mismatch creates a blind spot. Brands tracking only organic keyword rankings consistently overestimate their AI search presence. Research from Search Engine Journal found that citations in Google AI Overviews from top-ranking organic pages have dropped sharply — meaning the correlation between search rank and AI citation is weakening, not strengthening.
GEO requires its own measurement framework.
The four metrics that define GEO performance
These four signals collectively describe how well your brand is positioned in AI-generated answers.
| Metric | What it measures | Why it matters |
|---|---|---|
| AI citation rate | How often your content is cited when AI tools answer your target prompts | Directly measures AI visibility; equivalent to keyword ranking in SEO |
| Share of voice | What percentage of AI responses to your target prompts include your brand vs. competitors | Shows competitive position in AI search |
| AI referral traffic | Sessions arriving from ChatGPT, Perplexity, Claude, and Google AI Overviews | Quantifies business impact of AI citations |
| Content prominence | Whether your source appears first, middle, or as supporting evidence in AI responses | Signals authority level; first-cited sources get more click-through |
These four metrics replace the keyword ranking report as the core GEO performance dashboard. They can be tracked today with existing tools — no proprietary data access required.
How to track each GEO metric
AI citation rate is measured by running a consistent set of target prompts through ChatGPT, Perplexity, and Google AI Overviews, recording whether your content appears, and calculating the percentage of prompts where it does. Run the same prompts weekly using a standardized template. Tools like Peec.ai, Profound, and Ahrefs' AI citations dashboard automate this tracking.
Share of voice requires running the same prompt set and recording which competitors appear alongside (or instead of) your content. The output is a competitive share chart: "In responses to our 30 target prompts, we appear in 14%, Competitor A appears in 38%, Competitor B appears in 22%." This data directly informs which prompts need additional optimization.
AI referral traffic is the most straightforward metric. In Google Analytics 4, AI traffic is tracked as a built-in source. ChatGPT, Perplexity, and Claude referrals appear as direct source entries. No UTM tags or regex required. Filter by source to isolate AI-originated sessions and measure their conversion rate against organic benchmarks.
Content prominence requires manual review of AI responses that cite your content. Is your source the primary citation (appears first in the response) or supplementary (appears at the end as "learn more")? First-cited sources receive significantly more click-through from users who want to verify or read further.
What Cintra's tracking shows across clients
Cintra runs weekly GEO audits across all managed clients using a standardized prompt set of 15–30 target queries per brand. The pattern across clients reveals three consistent findings.
First, AI visibility moves faster than organic rankings. Keywords.am went from a 3% AI visibility score to 13% in two weeks after Cintra deployed GEO-optimized content targeting specific buyer prompts. Organic rankings for the same content took several additional weeks to improve.
Second, citation rate and traffic don't always correlate linearly. Some clients rank in 60% of AI responses but receive minimal AI referral traffic because their content appears as supporting citations rather than primary sources. Content prominence matters as much as citation frequency.
Third, share of voice reveals the real competitive gap. Most clients discover that their largest competitor has 3–5× greater AI share of voice on core buyer queries — a gap invisible to traditional SEO reporting.
| Client | Metric tracked | Before | After | Timeline |
|---|---|---|---|---|
| Keywords.am | AI visibility score | 3% | 13% | 2 weeks |
| Hamming.ai | Daily AI-referred visits | ~0 | 300+ | 12 weeks |
| UV Blocker | AI-referred clicks (cumulative) | 0 | 38,000 | 6 months |
Tools for measuring AI visibility
Purpose-built GEO measurement tools have emerged alongside the category. Each has different strengths.
| Tool | Best for | Citation tracking | Traffic tracking | Share of voice |
|---|---|---|---|---|
| Peec.ai | Real-time AI mention monitoring | ✓ | ✗ | ✓ |
| Profound | B2B brand visibility in AI | ✓ | ✗ | ✓ |
| Ahrefs AI Citations | Citation discovery + content analysis | ✓ | ✗ | ✗ |
| Google Analytics 4 | AI referral traffic measurement | ✗ | ✓ | ✗ |
| Manual prompt audit | Exact response content analysis | ✓ | ✗ | ✓ |
The minimum viable GEO measurement stack: GA4 for traffic (free) plus a weekly manual prompt audit across 10–15 target queries (free). Add a dedicated tool like Peec.ai or Profound when you need automated monitoring at scale.
How to build your GEO measurement baseline
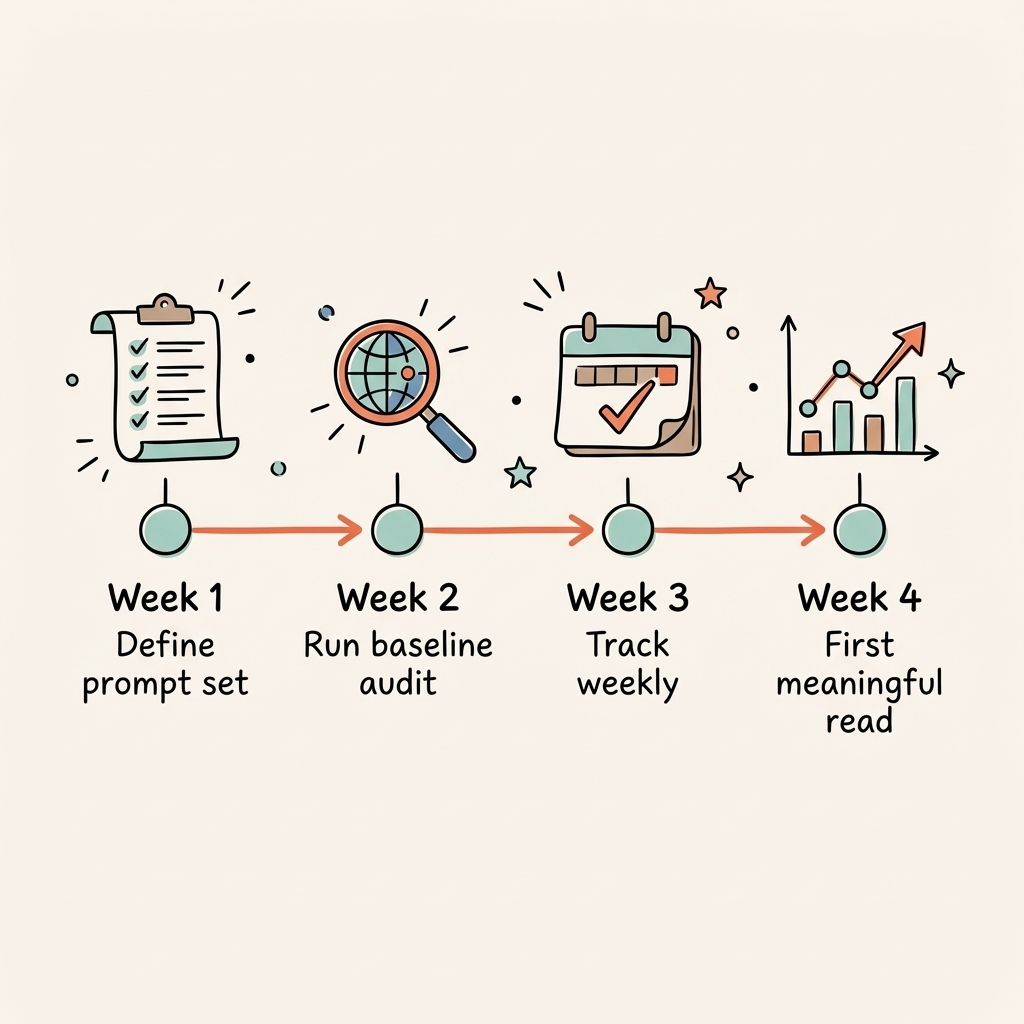
A measurement baseline requires four inputs: a defined prompt set, an initial audit, a recording template, and a weekly cadence.
Week 1: Define your prompt set. Choose 15–30 prompts that represent your buyers' most common AI search queries. Include: category-level questions ("What is the best [category] for [use case]?"), comparison queries ("How does [your product] compare to [competitor]?"), and problem-based queries ("How do I solve [problem your product addresses]?").
Week 1: Run the baseline audit. Manually run each prompt through ChatGPT (GPT-4o), Perplexity, and Google AI Overviews. For each response, record: did your brand appear? (Y/N), what position was it cited? (primary / supporting / not cited), which competitors appeared instead?
Week 2 onwards: Track weekly. Re-run the full prompt set each week. Log results in a spreadsheet or dedicated tool. Calculate citation rate as cited prompts / total prompts. Track share of voice as your citations / all citations in the response set.
Week 4: First meaningful read. After four weekly data points, you have enough to identify which content is driving citations, which prompts have zero coverage, and where competitors are dominating.
Brands running GEO campaigns with Cintra receive a weekly AI visibility report covering citation rate, share of voice across 15 core prompts, and traffic attribution from AI platforms.