AI Visibility Benchmarks by Industry: Cross-Industry Scorecard for 2026
AI visibility benchmarks across 10 industries from original scan data. Median scores, quartile ranges, platform breakdowns, and a self-assessment framework.
TL;DR
- The median AI visibility score ranges from 41 (CPG/Supplements) to 62 (SaaS/B2B) across 10 industries.
- The gap between top and bottom quartiles spans 44-49 points depending on industry.
- A brand can see a 615x difference in citation volume across different AI platforms.
- Content depth and comprehensive schema markup separate the leaders from the laggards.
- Most brands can improve their scores by 15-25 points within 90 days.
The performance gap between top and bottom brands widened from 32 to 42 points in a single quarter. This shift happened between Q4 2025 and Q1 2026. Most companies treat AI visibility as binary. They assume they're either visible or invisible.
But AI visibility benchmarks tell a different story. It's a spectrum with enormous variance by industry, platform, and quartile. Without benchmark data, you can't tell if a score of 48 is something to celebrate or a sign you're falling behind. (Spoiler: it depends entirely on your vertical.)
Why Do AI Visibility Benchmarks Matter Right Now?
AI visibility benchmarks matter because the performance gap between top and bottom brands widened from 32 to 42 points in one quarter, making ignorance increasingly expensive.
AI referral traffic now accounts for 1.08% of all website traffic. It's growing by roughly 1% month over month. That volume seems small. But the acceleration curve is steep, and brands failing to establish presence today will struggle to catch up tomorrow.
Many companies operate without baselines. They set arbitrary targets or simply assume their performance is acceptable. Consider an e-commerce brand with a visibility score of 48. The marketing team might celebrate this as average. They're actually sitting in the bottom quartile for their industry. A solid AI visibility playbook requires knowing your actual starting point. Understanding what AI visibility really means gives you that foundation.
Self-sabotage remains common. Foglift's Q1 2026 research found 27% of brands still block AI crawlers in their robots.txt files. They actively prevent their own inclusion in AI recommendations. Fixing this costs nothing. It only requires basic technical awareness.
Our latest AI search statistics roundup confirms the rapid shift in user behavior. You need precise comparisons to justify investments and evaluate your citation rates. Ignorance carries a compounding cost.
How Does Cintra Measure AI Visibility?
See where you rank across all AI answer engines.
Enter your domain and we'll scan your citation rate across ChatGPT, Perplexity, and Google AI.
Prefer to talk? Book a free 30-min call
We measure AI visibility by scanning buyer-intent prompts across ChatGPT, Perplexity, Google AI Mode, and Gemini, then scoring brands on four metrics: mention rate, citation rate, share of voice, and average position.
Our methodology relies on four distinct metrics:
- Mention Rate tracks the percentage of prompts where your brand appears by name.
- Citation Rate measures how often responses include a direct link to your site.
- Share of Voice (SOV) calculates your slice of total mentions among all competitors.
- Average Position identifies your mean ranking when recommended. A position of 1 means the AI listed you first.
We scan ChatGPT, Perplexity, Google AI Mode, and Gemini. These four engines process over 90% of all AI search traffic. ChatGPT alone drives 87.4% of AI referral traffic. Focusing on these platforms provides the most accurate reflection of real-world visibility.
Different vendors use different scoring systems. This makes cross-study comparisons unreliable. Our single-methodology approach ensures an apples-to-apples comparison. You can read exactly how to measure AI visibility using our standardized framework.
We use 25 to 50 buyer-intent queries per vertical. We don't test generic questions. We run prompts like "best CRM for small business" or "top supplements for iron deficiency." These queries mimic actual consumer behavior. The responses show exactly who wins the recommendation.
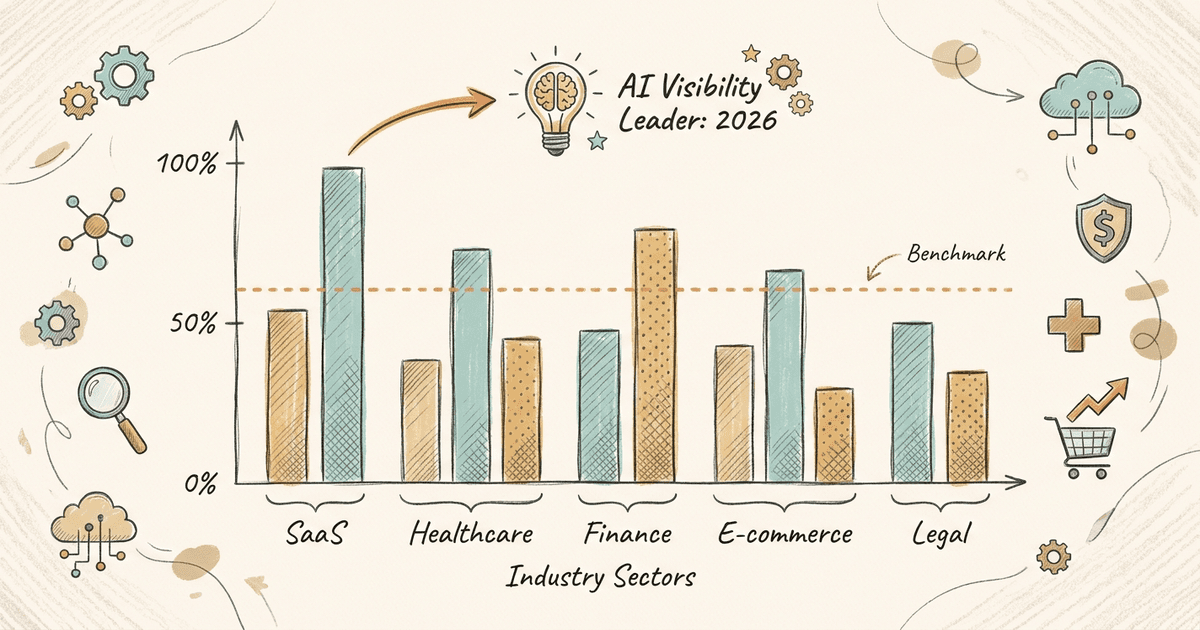
What Are the AI Visibility Benchmarks by Industry?
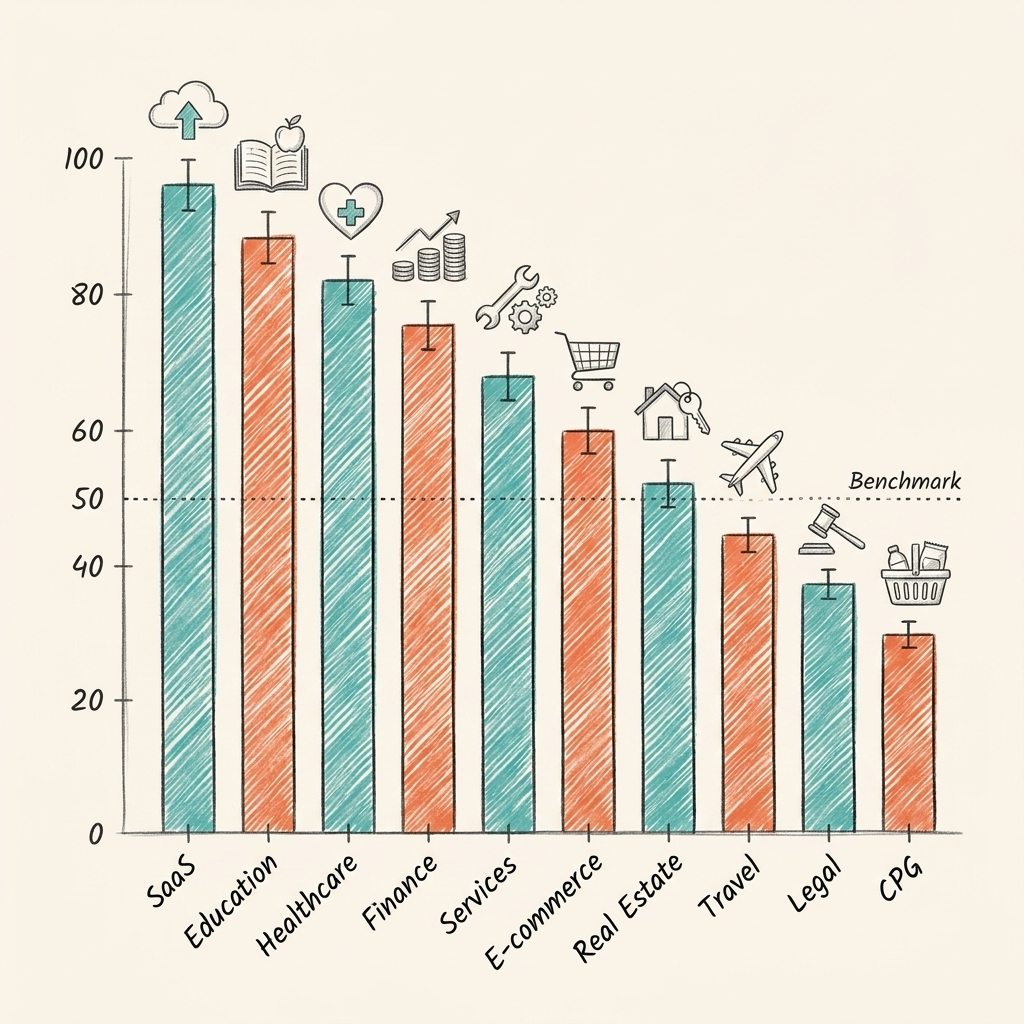
AI visibility scores range from a median of 41 in CPG/Supplements to 62 in SaaS, with top-quartile brands outscoring bottom-quartile by 35-48 points depending on industry.
Our cross-industry AI visibility benchmarks scorecard reveals wide disparities. The baseline for success changes completely depending on your vertical. A strong score in one sector can represent bottom-quartile performance in another.
| Industry | Bottom 25% | Median | Top 25% | Gap |
|---|---|---|---|---|
| SaaS/B2B | 38 | 62 | 84 | 46 |
| Education/EdTech | 33 | 58 | 81 | 48 |
| Healthcare | 31 | 55 | 79 | 48 |
| Financial Services | 29 | 53 | 76 | 47 |
| Professional Services | 26 | 51 | 74 | 48 |
| E-commerce/DTC | 24 | 48 | 73 | 49 |
| Real Estate | 27 | 47 | 71 | 44 |
| Travel & Hospitality | 25 | 46 | 70 | 45 |
| Legal | 23 | 44 | 69 | 46 |
| CPG/Supplements | 20 | 41 | 67 | 47 |
Scores are calculated out of 100 based on our standard evaluation criteria.
Why SaaS Leads
SaaS leads the pack because content depth and integration documentation are native to the industry. SaaS companies publish extensive knowledge bases, detailed API docs, and structured feature comparisons. AI models pull heavily from these detailed specifications. An AI content audit often reveals SaaS companies naturally produce AI-friendly structures without even trying.
The Healthcare E-E-A-T Barrier
Healthcare faces a steep barrier. The sector shows a 48-point gap between top and bottom performers. Credentials and trust signals gatekeep visibility here. Medical content requires rigorous fact-checking, author credentials, reviewed-by tags, and citations to authoritative journals. AI engines prioritize verified medical information over generic health advice.
The CPG Wake-Up Call
CPG and supplements lag behind every other sector. These brands rely heavily on retailer listings (Amazon, Walmart) and neglect their owned content. Brands outsourcing product descriptions to third-party retailers sacrifice their direct AI visibility. Unique product specifications and detailed customer reviews help close the gap.
How Does AI Visibility Vary Across Platforms?
The same brand can see citation volumes differ by 615x between platforms, and the ChatGPT-Perplexity correlation is only 0.78, strong but far from identical.
Performance consistency across AI engines is a myth. The correlation between ChatGPT and Perplexity sits at 0.78. Brands visible on ChatGPT usually perform well on Perplexity. But 22% of the variance remains unexplained. ChatGPT pulls heavily from long-form content. Perplexity acts more like a search engine and relies on recent citations and fresh sources.
Google AI Overviews operate by different rules. The correlation between AI Overviews and either ChatGPT or Perplexity drops to just 0.54. Google relies heavily on its traditional index priority. Ranking in traditional search heavily influences AI Overview inclusion.
The Superlines study found a 27.01% citation rate on Grok compared to 0% on Claude for the same brand. That's a 615x difference. You can't optimize for a single engine and expect universal visibility.
Platform Patterns by Industry
- Healthcare: AI Overviews inclusion ranges from 3% (bottom quartile) to 38% (top quartile). E-E-A-T signals gate this sector heavily.
- SaaS: Achieves the highest ChatGPT citation rates (12-61%) due to documentation-heavy content.
- E-commerce: Perplexity shopping citations emerging as a differentiator, with rates from 3% to 37%.
- Real Estate: Lowest AI Overviews trigger rate at just 4.48%.
What Separates Top-Performing Brands From the Rest?
Top-quartile brands share four traits: deep content over thin pages, comprehensive schema markup, regular freshness signals, and strong E-E-A-T credentials from authoritative backlinks.
Content depth beats volume. Fifty deep pages outperform 500 thin pages by 3.2x in AI citation rate. Quality matters more than quantity. AI models prioritize exhaustive answers over superficial coverage.
Technical structure drives results. Brands with comprehensive JSON-LD score 23 points higher on average. Top performers boast 95% schema coverage. Bottom performers sit at just 12%. Implementing proper schema markup for AI visibility gives the models explicit data relationships.
Monitoring frequency impacts growth. Weekly monitoring correlates with 2.4x faster improvement compared to quarterly checks. Brands that measure more frequently adapt more quickly. Freshness signals prove information remains current.
Credibility acts as a multiplier. Backlinks from .gov, .edu, and high-authority domains boost citation rates by 31%. This explains the 48-point gap in healthcare. Establishing E-E-A-T for AI search creates a barrier competitors can't easily replicate.
Page format influences selection. Pages with dedicated FAQ sections are 2.8x more likely to be cited. Clear question-and-answer formats map directly to how users interact with AI engines.
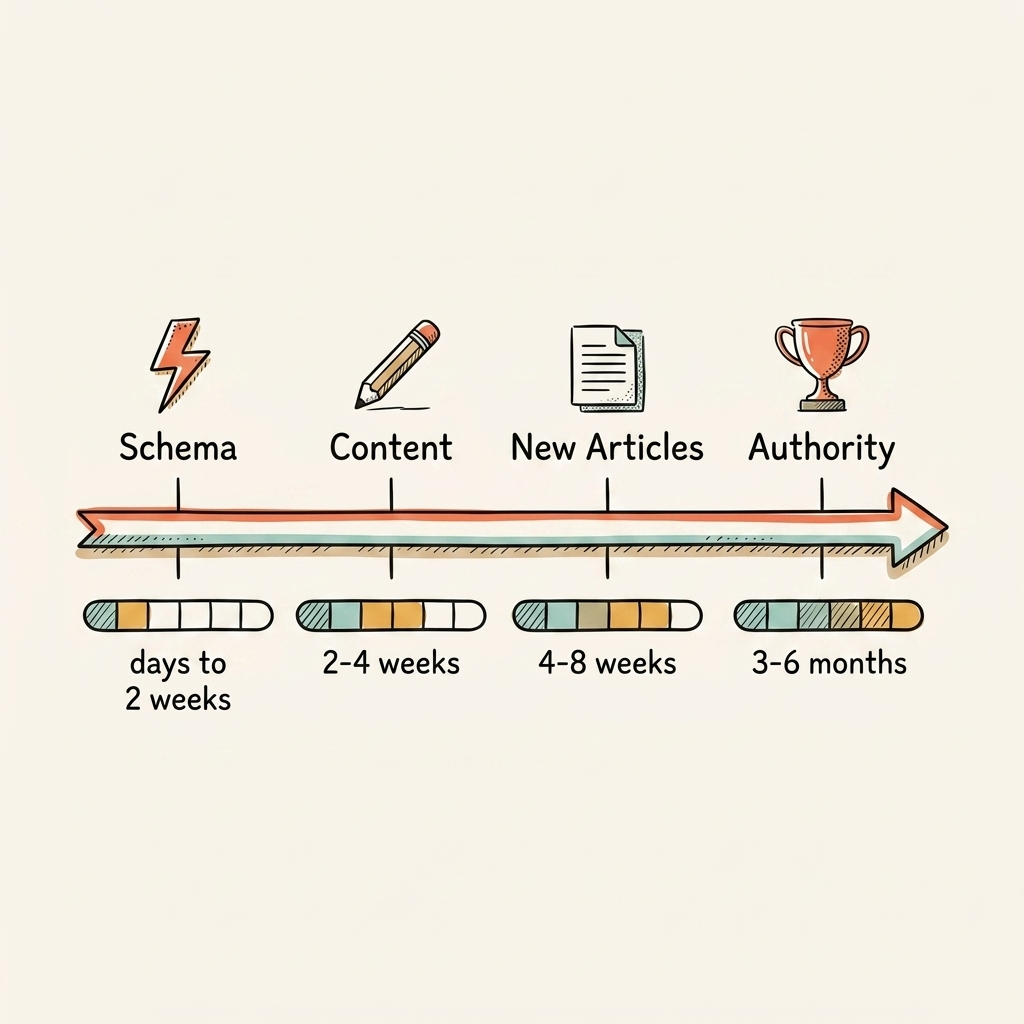
How Long Does It Take to Improve AI Visibility?
Most brands see measurable improvement of 15-25 points in 90 days, with schema fixes showing results in days and authority-building taking 3-6 months.
Speed to impact depends on your intervention strategy. The timeline breaks down into four phases:
- Schema markup (fastest): JSON-LD implementation shows indexing changes in days to two weeks. The engines process structured data on their next crawl.
- Content restructuring (2-4 weeks): Reformatting existing pages for AEO, adding answer capsules and FAQ sections, helps models parse information faster.
- New content creation (4-8 weeks): Fresh pages need crawling, processing, and integration into retrieval systems before they appear in AI responses.
- Authority building (3-6 months): Earning authoritative backlinks and E-E-A-T signals compounds slowly but provides the most durable competitive defense.
AEOfix's research shows distinct industry timelines. B2B Services start with the lowest baseline (29%) but show the highest improvement at +121% in 20-26 days. Local Businesses start high (52%) and improve by 56% in 14-18 days. Finance faces the slowest improvement timeline at 22-28 days due to compliance content requirements.
Citation drift complicates planning. Month-over-month citations fluctuate heavily in e-commerce and news. Healthcare and finance remain comparatively stable. Your monitoring cadence should match your industry's citation volatility.
How Can You Benchmark Your Own AI Visibility?
Run 10-15 buyer-intent prompts across ChatGPT, Perplexity, and Google AI Mode, track whether your brand is mentioned, cited, and ranked, then compare against the industry medians above.
You can assess your baseline today. Here's the DIY framework:
- Pick 10-15 prompts your actual buyers use. Focus on high-intent queries like "best CRM for small business" or "top legal services in Chicago."
- Run each prompt in ChatGPT, Perplexity, and Google AI Mode. Use incognito windows. Clear your cache. Prevent personalization from skewing results.
- Record three data points for every response: Was your brand mentioned? Was it linked? What position?
- Calculate your averages for mention rate, citation rate, and average position.
- Compare against the scorecard above.
Scoring Guide
- 70+: Top quartile. Focus on monitoring and maintaining your position.
- 50-69: Median range. You have significant upside from structured improvements.
- Below 50: Bottom quartile. Take immediate action on schema and content depth.
Frequently Asked Questions About AI Visibility Benchmarks
These are the most common questions we hear from brands evaluating their AI visibility for the first time.
What is a good AI visibility score?
A good score depends on your industry. SaaS brands should target 62 or higher as a baseline. E-commerce brands should aim for 48 or higher. Top-quartile brands consistently score between 67 and 84 across all industries we track.
How volatile are AI citations?
Citation stability varies by industry. Healthcare and finance citations remain relatively stable month over month. E-commerce and news citations fluctuate significantly as platforms update their underlying models and index data.
What is citation drift?
Citation drift measures the month-over-month change in how often AI models recommend a specific brand. High drift means your visibility can swing 10-15 points between months without any changes to your website content.
How do you measure AI share of voice?
We calculate AI share of voice by dividing a brand's mentions across a set of industry prompts by the total mentions of all tracked competitors. A 15% SOV means your brand captures 15 out of every 100 AI recommendations in your category.
How do AI visibility benchmarks differ by industry?
SaaS and education lead with median scores of 58-62. CPG and legal lag at 41-44. The primary drivers are content depth and structured data adoption, which vary sharply across verticals.
Conclusion
The AI visibility benchmarks data paints a clear picture:
- The gap between visible and invisible brands widens every quarter.
- Industry context dictates success. A score of 50 is median in SaaS but top-quartile in CPG.
- Schema markup, content depth, and E-E-A-T signals move scores the fastest.
- Your monitoring cadence should match your industry's citation volatility.
Stop guessing about your performance. Run 10 buyer-intent prompts across ChatGPT and Perplexity right now. Score yourself against the AI visibility benchmarks above.
See where your brand appears in AI search
Scan ChatGPT, Perplexity, and Google AI across buyer-intent queries, instantly, no sign-up.
Find out if AI is sending buyers to your competitors.
We audit your AI visibility across ChatGPT, Perplexity, and Google AI –and show you exactly where you rank and what to fix.
“We went from 200 visitors/day to 1,900 visitors/day and 40% of demos are from AI search.”
Sumanyu Sharma · CEO, Hamming.ai
“Cintra helped me go from 3k to 7.5k daily traffic and doubled weekly orders in 1.5 months.”
Russ Coulon · Owner, UV Blocker
“We saw a lift from 3% to 13% visibility in the first 2 weeks, and organic traffic hit its highest ever.”
Ash Metry · Founder, Keywords.am
Related Articles
Organic Traffic Decline 2026: Why It's Dropping and How to Recover
Organic traffic decline 2026 is real. AI Overviews cut clicks 38% on triggered queries. Here's what's causing…
AI Visibility Reporting: What to Track, Who to Tell, and How to Prove ROI
AI visibility reporting requires different metrics and formats than SEO reports. Learn the five core metrics,…
AI Visibility Competitive Analysis: How to Find and Exploit Gaps in 2026
AI visibility competitive analysis across ChatGPT, Perplexity, and 5 other engines. Framework for tracking com…