AI Visibility Reporting: What to Track, Who to Tell, and How to Prove ROI
AI visibility reporting requires different metrics and formats than SEO reports. Learn the five core metrics, three audience frameworks, and zero-click attribution methods.
TL;DR
- AI visibility reporting needs its own format because AI engines recommend brands without always generating a click.
- Citation share, AI share of voice, prompt coverage, sentiment accuracy, and revenue attribution are the core metrics.
- One report won't work for every stakeholder. Weekly, monthly, and quarterly views solve that mismatch.
- Zero-click attribution isn't clean, but branded search lift, surveys, UTM tracking, and lag analysis all help.
- A fixed prompt set matters. Changing prompts between periods breaks trend data.
900 million people use ChatGPT every week. When they ask what to buy, which vendor to trust, or which brand leads a category, one thing matters: whether the brand gets recommended.
Traditional SEO reports don't answer that question. They track clicks, rankings, and traffic, while AI visibility plays out in zero-click conversations that leave no obvious trail in analytics. Measuring AI visibility with SEO reports is like measuring podcast influence by counting website visits. The signal is there, but the report misses it.
This guide covers:
- The five metrics every AI visibility report needs
- Three report formats for content teams, CMOs, and boards
- Four ways to solve the zero-click attribution problem
We build these reports for clients every month. The framework below is the one we use in practice.
Why Don't Traditional SEO Reports Work for AI Visibility?
Traditional SEO reports track rankings, clicks, and traffic, none of which show whether AI engines recommend a brand in zero-click conversations.
That gap matters because the search market is shifting. Gartner predicted that 25% of traditional search volume would move to AI chatbots by 2026, and that traffic won't show up in Google Analytics. If a CMO asks whether the brand appears in ChatGPT or Perplexity, a ranking report can't answer it. For the foundational model behind that shift, see what is AI visibility.
The mismatch is bigger than one channel. Digital Bloom found only 11% overlap between domains in AI-generated answers and Google's top 10 organic results. Being number one in Google doesn't guarantee AI recommendation share. That's why the questions change from "What rank was earned?" to "Which prompts cite the brand, on which platforms, and with what accuracy?"
That calls for different measurements entirely: citation share, prompt coverage, sentiment accuracy, and the revenue links that sit behind them.
What Are the Five Metrics Every AI Visibility Report Needs?
See where you rank across all AI answer engines.
Enter your domain and we'll scan your citation rate across ChatGPT, Perplexity, and Google AI.
Prefer to talk? Book a free 30-min call
Every AI visibility report needs five metrics: citation share, AI share of voice, prompt coverage, sentiment accuracy, and revenue attribution.
The first four describe visibility quality. The fifth proves business value. Together, they give leadership a report that says more than "mentions went up."
| Metric | What It Measures | Frequency | Difficulty |
|---|---|---|---|
| Citation Share | Brand citations divided by total category citations | Monthly | Medium |
| AI Share of Voice | Appearance rate across buyer-intent prompts versus competitors | Monthly | Medium |
| Prompt Coverage | Percent of relevant prompts where the brand appears | Monthly | Low |
| Sentiment Accuracy | Whether AI statements about the brand are correct | Monthly | High |
| Revenue Attribution | AI-influenced pipeline and conversions | Monthly or quarterly | Very high |
Citation share is the anchor metric. If AI engines cite 4 brands across 50 prompts and one brand appears 18 times, citation share is 36%. That number means something only when the category is fixed and the prompt set stays stable month to month.
AI share of voice is different. It measures competitive appearance rate across buyer-intent prompts, so it shows position, not just volume. A brand can have decent citation share in a narrow segment and still trail a competitor across the category.
Prompt coverage is the cleanest operational metric. If a brand appears in 14 of 40 relevant buyer prompts, coverage is 35%. Semrush recommends using a fixed set of 20 to 50 prompts each month, because changing the set breaks trend data.
Sentiment accuracy checks whether the model says the right things. A brand cited alongside a competitor's pricing or an outdated feature list is worse than no mention at all. The report should flag wrong pricing, wrong packaging, wrong positioning, and missing compliance language.
Revenue attribution is the hardest metric, and it deserves its own section. AI visibility doesn't always convert in a single tracked click, which means the report has to connect citations to pipeline through indirect signals.
For the full measurement methodology behind these metrics, see how to measure AI visibility.
How Should You Structure AI Visibility Reports for Different Stakeholders?
Different teams need different depth. A content team needs prompt-level detail. A board needs a market position and a decision.
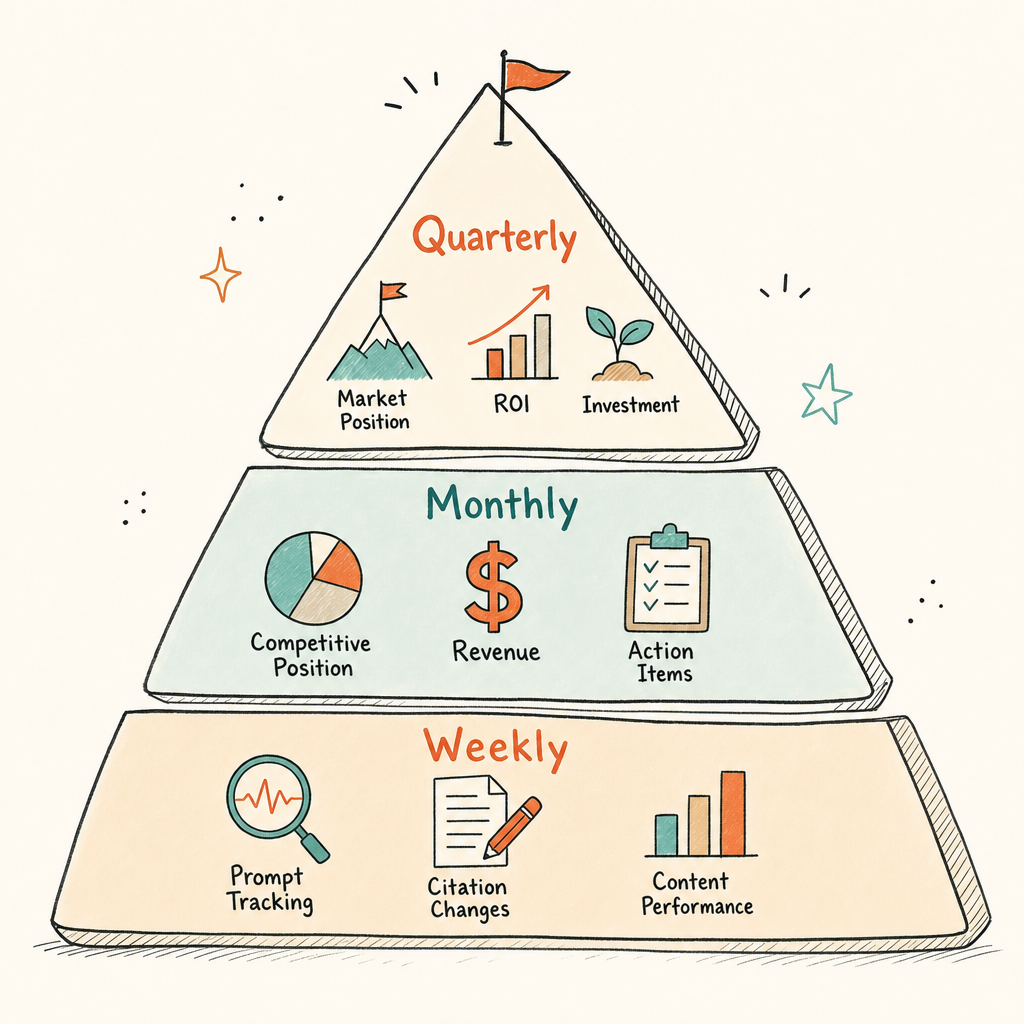
The fix is a three-tier AI visibility reporting system: weekly tactical, monthly operational, and quarterly strategic. Each one answers a different question, and none of them should try to do all three jobs at once.
Weekly Tactical Dashboard (Content/SEO Team)
This version belongs to the people doing the work. It should show citation changes by prompt, prompt coverage shifts, new competitor appearances, and content performance measured by AI citations generated.
Each row should represent one prompt. Useful columns include prompt text, platform, brand cited, competitor cited, citation count, sentiment note, and recommended action. That format makes the next step obvious. If a product page disappears from three prompts, the team sees it fast.
Monthly Operational Report (CMO/VP Marketing)
This is the CMO view. Lead with the headline number, then explain the competitive context. A 2 to 3 page PDF or deck works well here.
The report should include a three-month citation share trend, competitive position changes, top-performing content, revenue attribution estimates, and next-month actions. This is where the AI visibility ROI conversation belongs, because budget holders care less about raw mentions than about what those mentions connect to.
Quarterly Strategic Rollup (Board/C-Suite)
Boards want signal, not noise. The quarterly view should fit into 1 or 2 slides and focus on four numbers: citation share trend, competitive rank, revenue attributed, and the investment recommendation.
That board-level framing keeps the story tight. A board does not need prompt-level detail. It needs a market position, the threat picture, and a clear choice.
How Do You Solve the Zero-Click Attribution Problem?
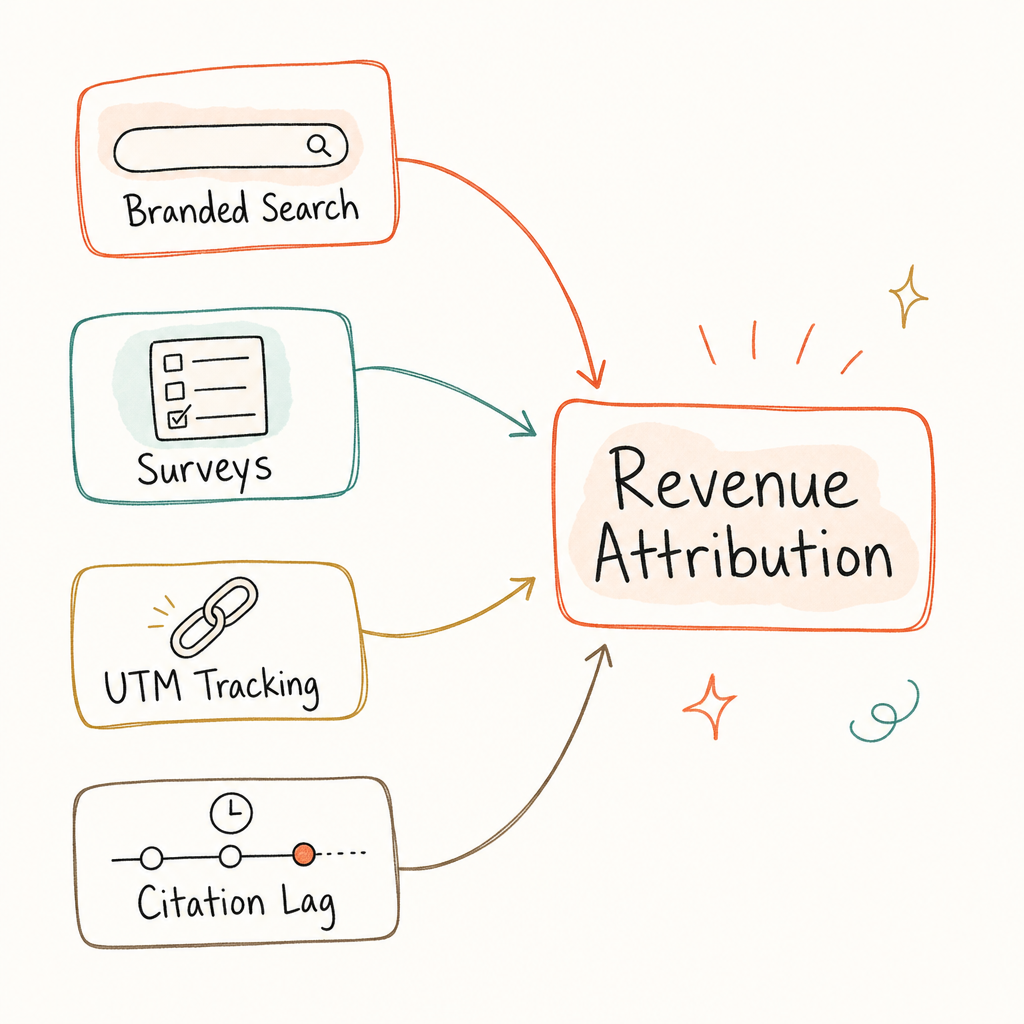
Zero-click attribution requires combining four indirect signals instead of pretending one metric can explain everything.
Start with honesty. AI visibility attribution is harder than SEO attribution, and leadership will see through overconfident claims. But "hard to measure" is not "impossible to measure." The goal isn't perfect causality. It's enough evidence to guide spend.
Method 1: Branded Search Lift Correlation
Track branded search volume in Google Search Console alongside AI citation share. When citations rise, branded search often follows 2 to 4 weeks later. That's correlation, not causation, but it is still the strongest indirect signal available.
Method 2: Self-Reported Discovery Surveys
Add one field to demo forms, checkout flows, or onboarding forms: "How did you hear about this brand?" Include "AI assistant (ChatGPT, Perplexity, etc.)" as an option. A direct question beats guesswork.
Method 3: AI UTM Tracking
Some AI platforms do send trackable traffic. Perplexity and AI Overviews can drive clicks, so those referrals should be tagged. Any direct links from AI-citing content should also carry UTMs. The click trails won't cover everything, but they catch real traffic where it exists.
Method 4: Citation-to-Pipeline Time-Lag Analysis
Map the time between the first AI citation and pipeline entry. If a pattern appears repeatedly, the case strengthens. Brainlabs found that LLM-referred traffic converts at 4.4x the rate of traditional organic traffic, which gives the revenue story real weight.
For the full business case with client results, see AI visibility ROI. For broader zero-click strategy, see zero-click search strategy.
Taken together, these four methods create a defensible AI search ROI reporting model, even when the click trail is thin.
What Are the Most Common AI Visibility Reporting Mistakes?
The most common mistakes are changing prompt sets between reporting periods, ignoring platform divergence, and reporting AI visibility in isolation from business results.
Changing prompt sets between periods. If January tracked 30 prompts and February tracked 40, the trend line stops being comparable. Semrush's fixed prompt set recommendation matters here because stable inputs create stable reporting. This is the number one mistake we see with new teams.
Reporting vanity metrics. "We got mentioned 47 times" sounds useful until a competitor was mentioned 96 times. Citation share tells the truth because it shows relative position, not raw volume.
Ignoring platform divergence. A brand can win in ChatGPT and disappear in Perplexity, or do the reverse. Aggregate reporting hides that split. Platform-level reporting exposes it. We had a client with 40% citation share in ChatGPT and 8% in Perplexity for the same prompts.
Missing competitor context. A 20% citation share looks fine until the category leader is at 55%. That gap changes the budget conversation fast.
Reporting AI visibility in isolation. If the board only hears that citation share rose 12%, the number stays interesting but not urgent. Pair it with branded search, survey data, or pipeline lag and the metric becomes a business signal.
How Do You Build Your First AI Visibility Report?
Build your first AI visibility report in four steps: select buyer prompts, run them monthly, track competitors, and connect results to business outcomes.
The work is straightforward once the inputs are defined. A first report doesn't need to be perfect. It needs to be consistent.
- Select 20 to 50 buyer-intent prompts. Pull them from sales calls, demo questions, support tickets, and search queries. A B2B SaaS set might include "best project management software for distributed teams," "how does [category] compare to [competitor]," and "which platform handles enterprise reporting best." See AI brand monitoring for the prompt selection methodology.
- Run the prompts across platforms every month. Use the same prompt set on ChatGPT, Perplexity, Claude, Gemini, and AI Overviews. Record whether the brand appears, what the model says, and which competitors appear alongside it.
- Track competitors on every prompt. This is where the report becomes useful to leadership. Top-3 or top-5 brand lists by prompt make AI share of voice visible over time.
- Connect results to business outcomes. Apply branded search lift, surveys, UTM tracking, and lag analysis. Even imperfect attribution is better than no attribution.
We track 100 to 200 prompts across 7 AI engines for every client, with results in a leads dashboard updated in real time. If building this manually isn't the right move, that's what we do.
What Does a Monthly AI Visibility Report Actually Look Like?
A monthly operational AI visibility report follows a consistent four-section structure: headline snapshot, competitive comparison, content performance, and next-month actions. Each section serves a different purpose and keeps the CMO focused on decisions, not raw data.
Section 1, Headline Snapshot (one slide or page)
Lead with three numbers: citation share this month, citation share last month, and the delta. Add a one-sentence interpretation. Example: "Citation share rose from 22% to 27%, driven by three new articles capturing buyer-intent prompts our competitors previously owned." That sentence tells the story. Everything else supports it.
Section 2, Competitive Comparison
A simple table works best here. Rows = competitors (including your brand). Columns = each AI platform (ChatGPT, Perplexity, AI Overviews, Claude). Cells = citation share or prompt coverage percentage. Highlight cells where you've gained or lost ground vs. the previous month. Platform divergence, where you win one engine and lose another, belongs in a footnote with a recommended action.
Section 3, Content Performance
List the top five performing articles or pages by AI citations generated this month. Next to each, show the prompt categories they're winning. This connects content investment directly to visibility outcomes, which is the data a CMO needs to justify the next content sprint.
Section 4, Next-Month Actions
Three bullet points maximum. Each one maps to a specific gap from this month's data. Example: "Publish comparison guide targeting 'ChatGPT vs Gemini for enterprise', competitor X owns this prompt on three platforms and we are absent." Actions tied to data get approved faster than open-ended content requests.
This four-section structure scales up to a board slide by condensing Sections 1 and 2 into a single chart, and scales down to a tactical weekly dashboard by expanding Section 3 to prompt-level detail.
Frequently Asked Questions About AI Visibility Reporting
These are the questions marketing teams ask most when the first AI visibility report is going to leadership.
How often should AI visibility be reported?
Weekly for the content or SEO team, monthly for the CMO or VP Marketing, and quarterly for the board. Match the cadence to the audience. More detail for practitioners, less for executives.
What tools are needed for AI visibility reporting?
A dedicated platform like Cintra's dashboard works well, but a spreadsheet plus access to ChatGPT, Perplexity, Claude, and AI Overviews is enough for the first 1 to 2 months. See how to measure AI visibility for the DIY audit path.
What is a good citation share?
It varies by industry and category competitiveness, but 20% to 30% in relevant buyer prompts is a strong starting position for most B2B brands. Track your own baseline first, then optimize from there.
How should a team start with no baseline?
How many prompts should be in the first report?
Twenty is enough to start, and 50 is usually the practical ceiling for a manual process. The key is staying fixed from one period to the next.
What if ChatGPT and Perplexity disagree?
Report the difference, don't smooth it away. Platform divergence often reveals where the category story is unstable, and that's useful data for the content team.
How do you present AI visibility ROI to a skeptical CFO?
Lead with analogy, then data. A CFO understands that brand advertising drives demand without always generating a trackable click. AI visibility works the same way: a recommendation in ChatGPT influences a purchase decision before the buyer ever visits the website. Then layer in the data: Brainlabs found LLM-referred traffic converts at 4.4x the rate of traditional organic. Pair that with your branded search lift correlation and any self-reported "heard about you from AI" survey data. The story doesn't need perfect attribution, it needs enough evidence to justify continued investment.
What should you do if citation share drops month over month?
First, check whether the prompt set changed, even adding five prompts can shift share calculations. If the set is stable, identify which specific prompts dropped and which competitors gained. Usually one competitor published a strong piece of content that displaced yours on freshness-sensitive platforms. The response is targeted: publish a more current, more comprehensive article on that topic and re-run the affected prompts two weeks later to verify recovery.
Conclusion
AI visibility reporting needs its own framework because SEO reports miss zero-click recommendations, stakeholder needs differ, and attribution has to be assembled from multiple signals.
- Use five metrics, not one. Citation share, AI share of voice, prompt coverage, sentiment accuracy, and revenue attribution each tell a different part of the story.
- Match the report to the audience. Weekly tactical dashboards for the content team, monthly operational reports for the CMO, quarterly strategic rollups for the board.
- Treat zero-click attribution as a multi-signal problem. Branded search lift, discovery surveys, AI UTMs, and citation-to-pipeline lag analysis work together.
The next move is simple. Select 20 buyer-intent prompts and run them across ChatGPT and Perplexity this week. That gives your team a baseline to build from.
We build these reports for every client, every month, from tactical dashboards to board decks. See what's included in each plan.
Related Reading
- AI Visibility Competitive Analysis, how to benchmark citation share against specific competitors and build a response plan from the data
- AI Visibility at Scale: The Multi-Brand Enterprise Playbook, how to structure reporting governance when you are managing AI presence across multiple brands
- Organic Traffic Decline 2026, the context behind why AI visibility metrics matter: where the traffic went and how to measure its replacement
See where your brand appears in AI search
Scan ChatGPT, Perplexity, and Google AI across buyer-intent queries, instantly, no sign-up.
Find out if AI is sending buyers to your competitors.
We audit your AI visibility across ChatGPT, Perplexity, and Google AI –and show you exactly where you rank and what to fix.
“We went from 200 visitors/day to 1,900 visitors/day and 40% of demos are from AI search.”
Sumanyu Sharma · CEO, Hamming.ai
“Cintra helped me go from 3k to 7.5k daily traffic and doubled weekly orders in 1.5 months.”
Russ Coulon · Owner, UV Blocker
“We saw a lift from 3% to 13% visibility in the first 2 weeks, and organic traffic hit its highest ever.”
Ash Metry · Founder, Keywords.am
Related Articles
Organic Traffic Decline 2026: Why It's Dropping and How to Recover
Organic traffic decline 2026 is real. AI Overviews cut clicks 38% on triggered queries. Here's what's causing…
AI Visibility Competitive Analysis: How to Find and Exploit Gaps in 2026
AI visibility competitive analysis across ChatGPT, Perplexity, and 5 other engines. Framework for tracking com…
Google Search Agents: What the I/O 2026 Announcement Means for Your Brand
Google search agents monitor topics 24/7 and push recommendations to 1B+ users. Learn what information agents…